Understanding Output of htop Command
Every Linux administrator and users have must come across the situation where the system has reached its saturation point and it starts consuming all of the resources allocated to it. At this particular time, we wholeheartedly want to identify the processes responsible for consuming such high resource usage. To identify such processes, we have many tools and commands available nowadays, but the best among all is htop.

htop allows you to monitor processes running on the system along with their full command lines. We can perform tasks related to processes (killing, renicing) without entering their PIDs. Htop allows us to sort the processes on the basis of CPU, Memory and Time Interval. It also allows us to sort all the processes owned by a particular user.
In our today’s tutorial, we are providing the detailed information about the usage of htop command for system monitoring. In our previous tutorial, we have demonstrated gtop. It is another command line system monitoring dashboard for Linux.
Understanding CPU Usage in htop

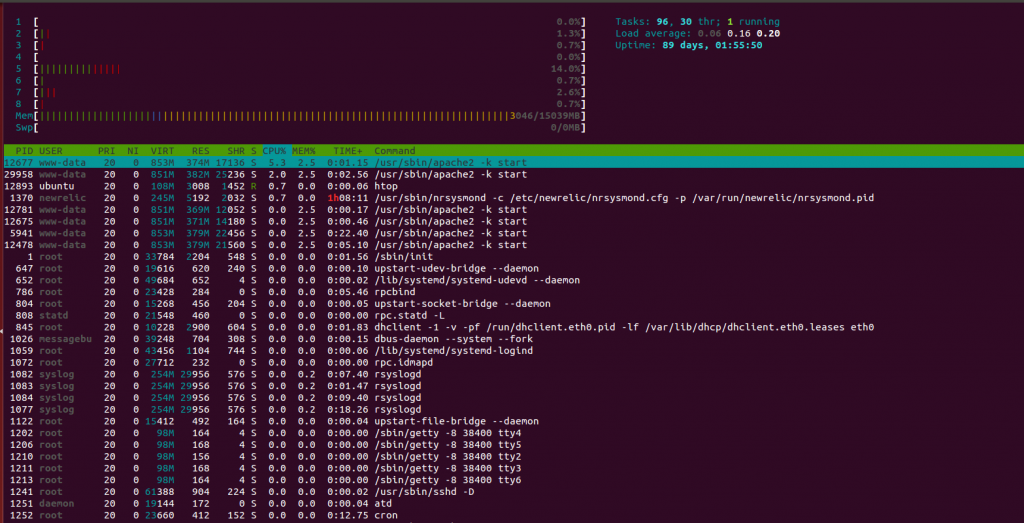
In reference to above screenshot, numbers 1 to 4 are the CPU/Cores of the system and the progress bar running next to it is describing its usage. One thing to notice here is that the progress bar contains multiple colors within it.
Have you ever wondered why there are multiple colors in progress bar?
Meaning and explanation of each color:
Blue: Display percentage of CPU used by low priority processes. (nice > 0)
Green: Displays percentage of CPU used for processes owned by normal users.
Red: Displays percentage of CPU used by system processes.
Orange: Displays percentage of CPU used by IRQ time.
Magenta: Displays percentage of CPU consumed by Soft IRQ time.
Grey: Displays percentage of CPU consumed by IO Wait time.
Cyan: Displays percentage of CPU consumed by Steal time.
Understanding Memory Usage in htop
Exactly below the CPU statistics, Memory and Swap usage are provided. Alike progress bars in CPU, Memory monitoring also contains progress bars with multiple colors.
Meaning and explanation of each color:
Green: Displays percentage of RAM consumed by memory pages
Blue: Displays percentage of RAM consumed by buffer pages
Orange: Displays percentage of RAM consumed by cache pages
Understanding Tasks, Threads, Running Processes, Load Average and System’s Uptime in htop

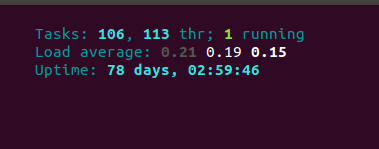
In reference to above screenshot, we have 106 tasks or processes running on the machine which are broken up into 113 threads and out of these only 1 process is in running state. You must be wondering, what are other processes doing then???
Tasks are the representation of the total number of open processes but not every open process is consuming CPU constantly. There are several states in which each process resides. Check these different states of processes below.
- R: Running – Refers to the processes actively using CPU.
- T/S: Traced/Stopped – Refers to the processes currently in stopped (paused) state.
- Z: Zombie or defunct – The process that has completed execution (via the exit system call) but still has an entry in the process table.
- S: Sleeping – Most common state for many processes. Generally, processes are in the sleep state for most of the time and perform small checks at a constant interval of time, or wait for user input before it comes back to running state.
Load Average: Refers to the Average load of the system. Three values are referring to the average load of a system for last minute, for last five minutes and for last 15 minutes.
Uptime: Refers to the system uptime since the last reboot.
Detailed Processes Information in htop
![]()
- PID – It describes the Process ID number.
- USER – It describes the process owner.
- PRI – It describes the process priority as viewed by the Linux kernel.
- N – It describes the process priority reset by the user or root.
- VIR – It describes the virtual memory that a process is consuming.
- RES – It describes the physical memory that a process is consuming.
- SHR – It describes the shared memory that a process is consuming.
- S – It describes the current state of a process.
- CPU% – It describes the percentage of CPU consumed by each process.
- MEM% – It describes the percentage of Memory consumed by each process.
- TIME+ – It displays the time since process execution has started.
- Command – It displays the full command execution in parallel to each process.
Shortcut Keys Used in htop

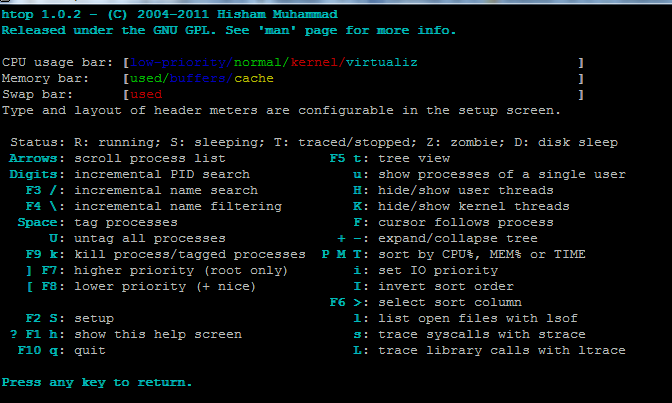
htop also has some shortcut keys to sort the process on basis of CPU, MEM or TIME consumption. It can also sort the processes owned by a particular user. See more details below.
- Arrow Keys – Use ‘Up and Down’ Arrow keys to scroll the processes in htop.
- u – Key ‘u’ is used to display all processes owned by a particular user.
- P – Key ‘P’ is used to sort processes on the basis of high CPU consumption.
- M – Key ‘M’ is used to sort processes on the basis of high Memory consumption.
- T – Key ‘T’ is used to sort the processes on the basis of the time period.
- h – Key ‘h’ is used to open help window and watch more shortcuts not mentioned here.
This brings an end to this explanation of htop command. Using htop we can identify and troubleshoot various factors causing sluggishness and system bottlenecks. We can enhance the system performance by using htop and it is all time favorite monitoring tool for UNIX based operating systems. Share this tutorial if you find it useful and for any questions please post in comment section. Stay tuned for more updates. Thanks!!


I can’t see very well the differences between ‘top’, ‘gtop’ and ‘htop’.
htop is similar to top but allows you to scroll vertically and horizontally, so you can see all the processes running on the system, along with their full command lines. Tasks related to processes (killing, renicing) can be done without entering their PIDs, whereas gtop only allows you to monitor the system resources in a CLI with a handy generated dashboard.